.jpg)
.jpg)
Fundamental Algorithm of GRRM : Open the door to the unknown world!
As fundamental algorithms for GRRM, ADDf was first developed, and afterward AFIR was introduced. Here, principles of GRRM are explained in terms of ADDf. AFIR can be referred to the section (10) Artificial Force Induced Reaction Method.ADD-following: Discovery of a "COMPUS" indicating directions of reaction routes
Exploring reaction pathways on the potential energy surface had long been believed to be impossible, when the number of atoms exceeds four, as described in an international text book "Introduction to Computational Chemistry" written by F. Jensen, in 1999.A key resolving this difficulty was discovered at Tohoku University in 2002. Anharmonic downward distortion (ADD) was found to behave as a compus indicating directions along which reactions proceed. As can be seen in the left figure above, the real potential in red always goes beneath the harmonic potential shown by dotted curve in blue associated with generation of ADD, on either going left to dissociate after bond-breaking EQ→DC or going right to perform reconstruction of chemical bonds EQ→TS→EQ. These characteristics of potential energy curves well known in every textbook reveal that directions with large ADDs indicate reaction pathways.
SHS (Scaled Hypersphere Search) : A special technique finding maximal directions of ADD after compensating anisotropies of harmonic potentials with scale factors using vibrational eigen values
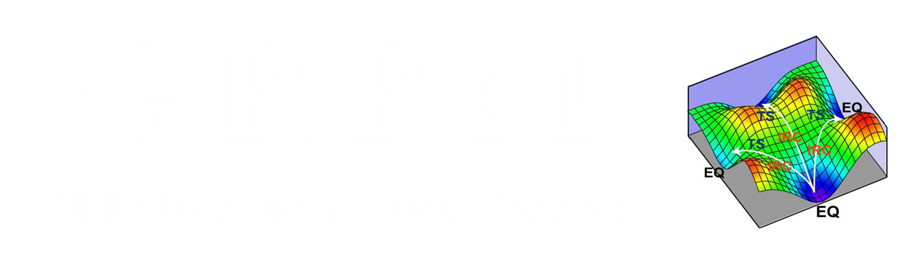
Lower energy directions from an equilibrium point EQ seem to indicate the ways toward transition structures of reactions. However, trials based on this idea will end in vain. Low energy directions are usually along low frequency normal modes, such as internal rotations and bending vibrations, which are usually far from reaction routes of bond-dissociation or bond-reorganization.Tracing along reaction routes from the bottom becomes possible by noting ADD. There are in general various normal modes around an EQ. Low frequency modes vibrate along flattened parabola, while high frequency modes vibrate along steep parabola. For finding ADD, differences in the shapes of parabolas become very hard obstacles. This problems can easily be solved when normal coordinates are scaled wtih roots of vibrational eigenvalues. With using scaled normal coordinates, the hypersurface with the same harmonic energy becomes a simple hypershere. Namely, any point on the hypersphere, where the distance is the same from the central point of EQ, has the same harmonic energy. It follows that minima of real potential energies on the scaled hypesphere indicate maximal directions of energy lowering, which correspond to ADD maxima.
Thus, by expanding sizes of scaled hyperspheres such real energy minima on the hyperspheres can be traced from inside to outside, to find out all reaction pathway surrounding an EQ. This is the scaled hypersphere search (SHS) algorithm equipped in the GRRM program. The birth of the SHS method made it possible to explore reaction pathways around an EQ automatically.
Global Reaction Route Mapping(GRRM): Chemical Reaction Channles on the potential energy surface become possible to be explored automatically
Use of the SHS method based on the ADD-following enables us to trace reaction pathways from an EQ to surrounding TSs. Downhill walkings from TSs reveal new EQs. Repetition of further SHS searches around new EQs yield the entire reaction pathways.(0) Optimization from a starting structure (can be generated rondomly) leads to an EQ.
(1) From the EQ, uphill walkings by ADD-following trace up reaction pathways to reach either TS or DC (Dissociation channel).
(2) An IRC tracing from TS also reaches either EQ or DC.
(3) For newly found each EQ, series of exploration (1)(2) are to be repeated.
(4) When no new EQ remains for (1), then the exploration ends.
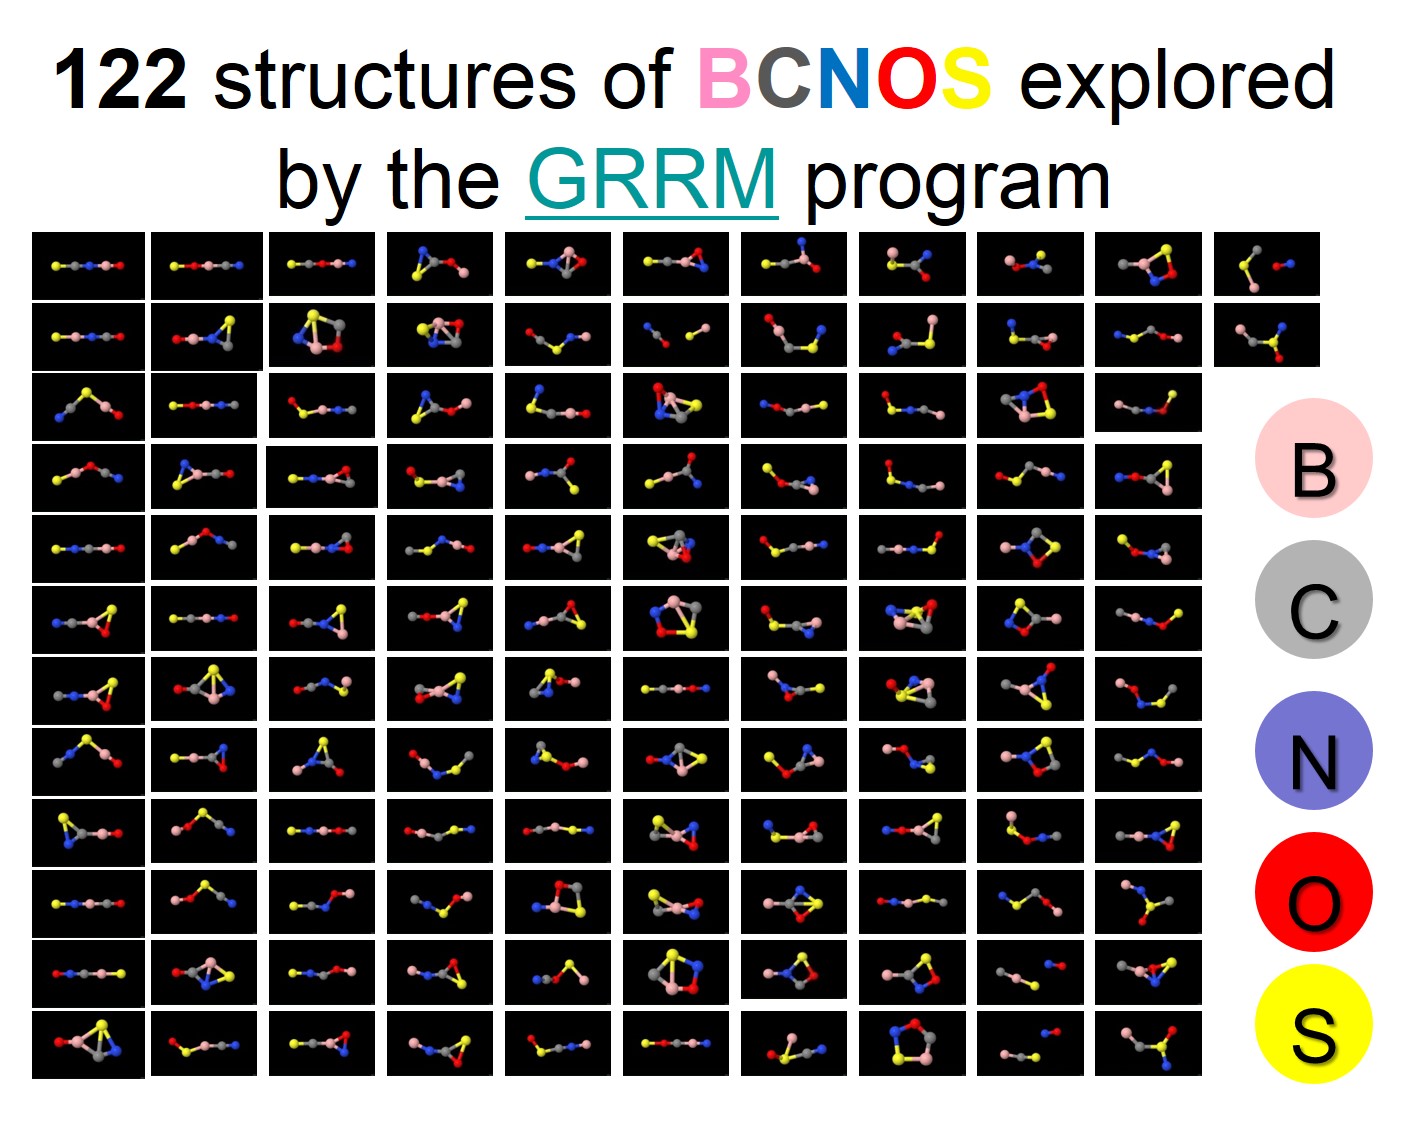
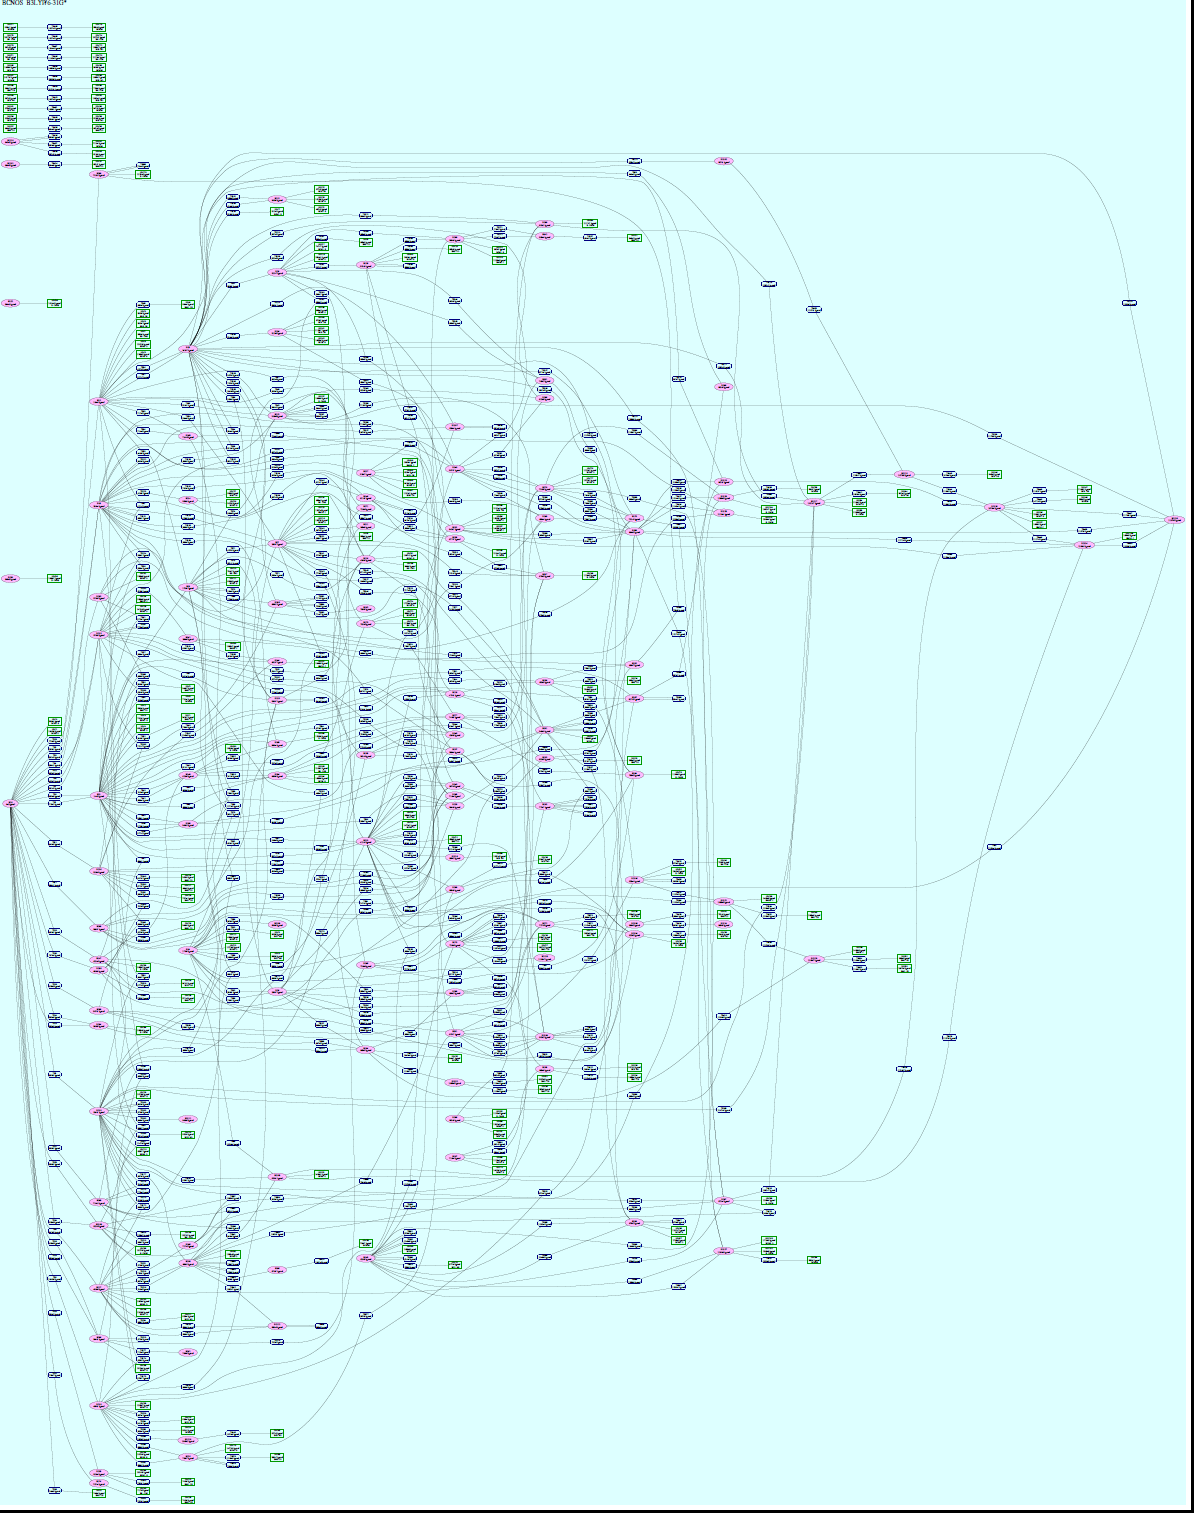
These procedures (0)-(4) enable us to perform Global Reaction Route Mapping (GRRM). The flow chart is shown in the left figure below. The right figure below shows a scheme of finding the entire reaction network. The GRRM method thus made it possible to explore the reaction network in an automated way for the first time.
.jpg)
.jpg)